Social Media Marketing: How Do Top Brands Use Social Platforms? [Charts]
By 2010, most big brands had figured out that they needed to get on Facebook and start engaging with their customers where they were more likely to be viewed as a “friend.” Soon after, top brands created Twitter accounts, joined Instagram and, most recently, started to use Vine.
Social media has added a new dimension to how brands market their goods. But is it really all that effective?
Over the past four years, less than 0.25 percent of e-commerce consumers of top brands came from Facebook. For Twitter, that number is less than 0.1 percent. In comparison, customer acquisition from paid search is up 50 percent.
However, engaging with consumers via social platforms is not a fruitless task. Of the top 10 factors that correlate with strong Google organic search, seven are social media dependent, according to a just-released study by think tank L2. This means that, if brands aren’t active on social media, they tend to show up less on Google searches.
The L2 report analyzed the social media activity of 247 top global brands across 15 social media platforms. Here’s what they found:
On average, most top brands are active on five to nine social media platforms:
Facebook, Twitter and YouTube remain the most popular platforms for top brands. Pinterest is more popular than Instagram. Vine, though still a very new platform, has also seen a lot of takers.
In China, Sina Weibo and Youku are the top choices of most top brands.
Cost will probably increase, and it is likely that many brands will pare down the number of social media platforms they’re on, the L2 report stated. This means brands are going to have to choose which platforms are the most effective.
The initial stages of social media were about showing up and experimenting; in the next chapter, organizations will strive to find their point of variance.
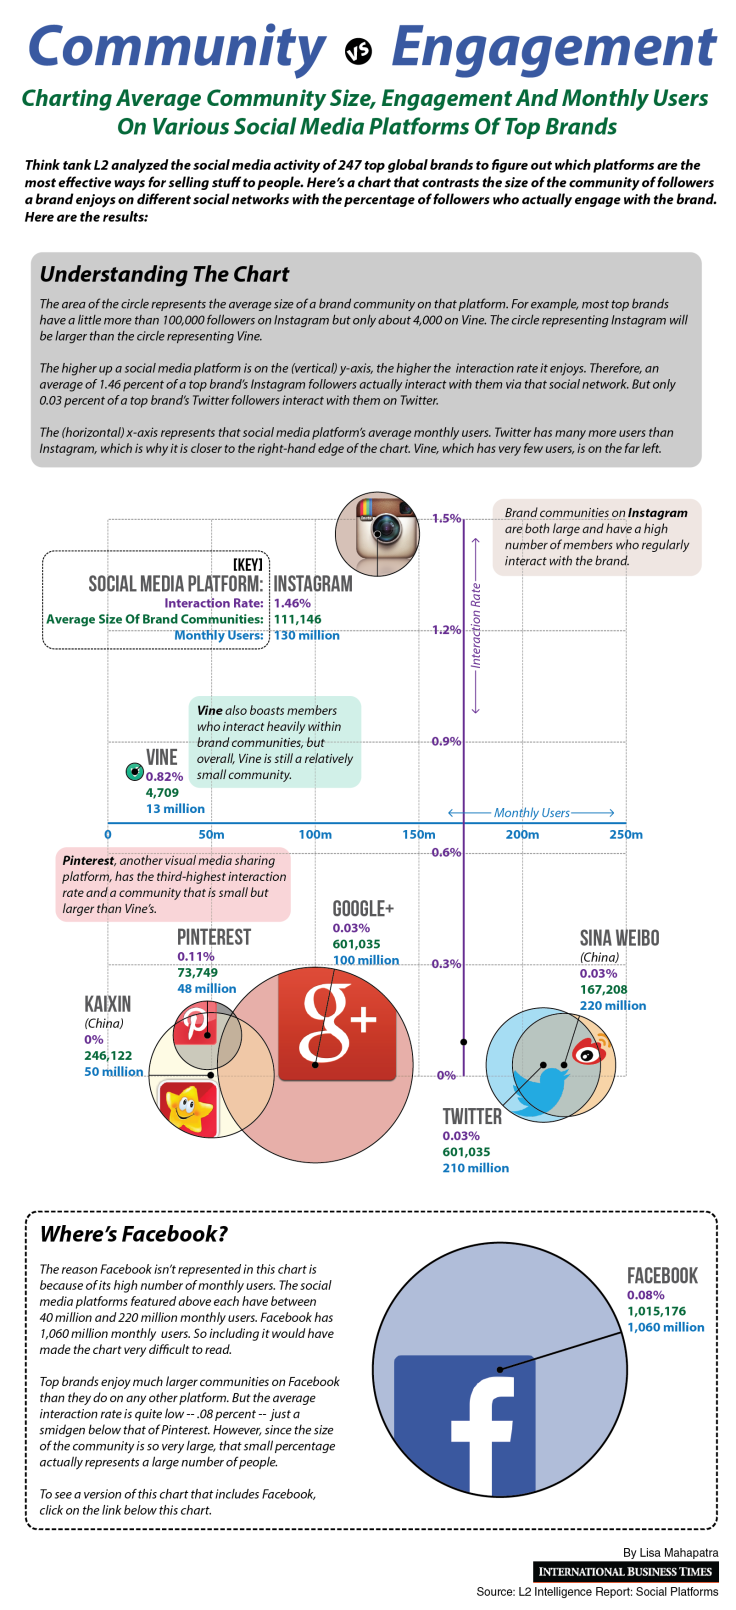
Visual platforms, most notably Instagram, register 25 times as much engagement from followers than do community-based platforms, the report said.
Here’s a visualization that charts average community size, engagement and total monthly users on a select set of social media platforms.

For a version of this chart that includes Facebook, click here.
© Copyright IBTimes 2024. All rights reserved.


