What The US Economy Is Missing: Jobs In The Middle Of The Pay Spectrum [CHARTS]
It’s true that many of the jobs added to the U.S. economy since the end of the Great Recession are positions that don’t pay very well -- mostly food-preparation and -service jobs as well as personal-care service jobs.
However, the U.S. economy has also seen strong job growth at the other end of the pay spectrum: More than 600,000 positions in the fields of mathematics, management and computer science were added between 2010 and 2012, according to an analysis of U.S. Bureau of Labor Statistics data by Josh Lehner, an economist with the Oregon Office of Economic Analysis.
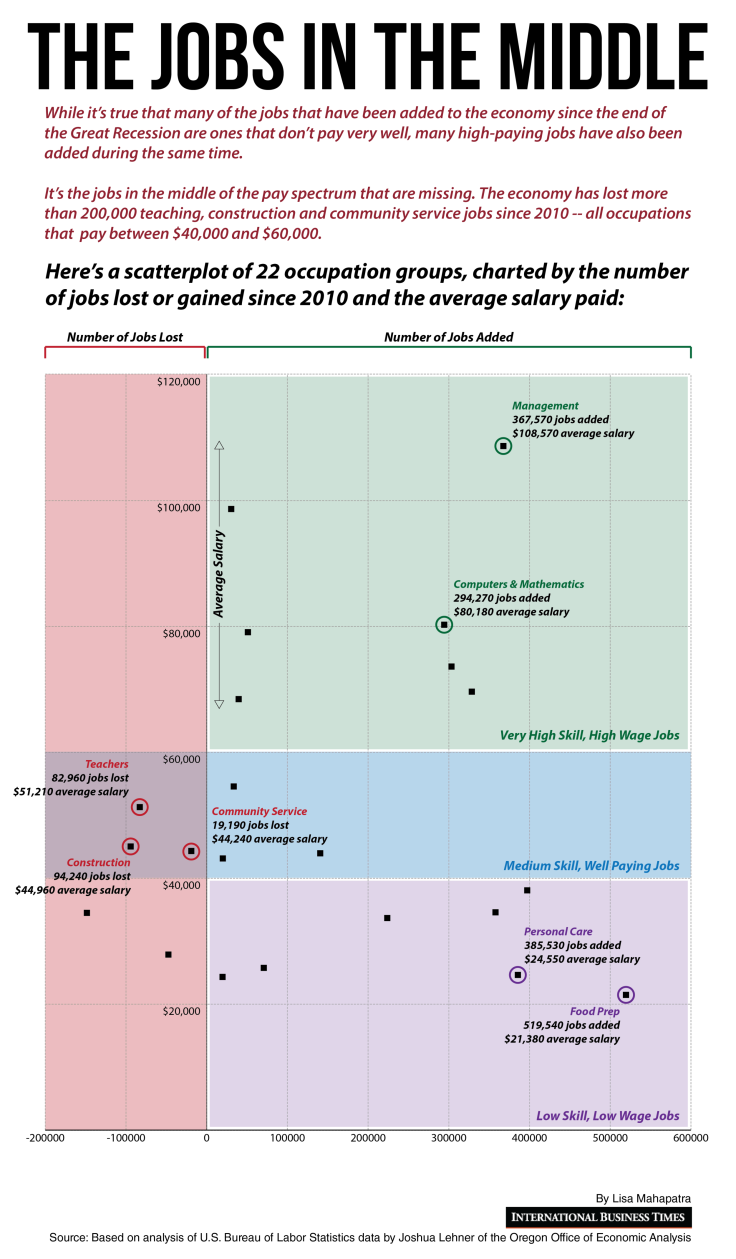
It’s the jobs in the middle of the pay spectrum that are missing. The economy has lost more than 200,000 teaching, construction and community-service jobs since 2010 -- all occupations that pay between $40,000 and $60,000 per year.
This means that people who are reasonably well-educated but don’t have highly technical skills or graduate degrees are stuck. The jobs they’re actually qualified for don’t exist, and the really well-paying jobs all require skill sets they don’t have. Such workers end up underemployed -- overqualified for the jobs that they can get and paid lower wages as a result.
According to Lehner, fundamental changes occurring in the labor market are best seen at the occupational level, not the industry level.
Here’s a scatterplot of 22 occupation groups, charted by the number of jobs lost or gained between 2010 and 2012 and including the average salary paid:

From this chart, it is obvious that the occupations in the blue slice of the chart -- i.e., those that pay between $40,000 and $60,000 annually -- are the ones that either expanded very slowly or actually contracted from 2010 to 2012.
Things aren’t going to get much better in the near future. Growth rates for these occupations will likely sag behind the rest of the economy in the years to come, according to Lehrner.
“This, by definition, is job polarization,” Lehner said in a blog post. “These patterns have been ongoing in the U.S. ... The process is exacerbated during recessions. These middle-wage occupations fell much further during the Great Recession and are growing much slower coming out, if at all.”
Here are the same data featured in the scatterplot, in the form of an interactive bar chart. Hover over any of the occupations to see the exact growth numbers and average annual wages:
© Copyright IBTimes 2024. All rights reserved.


