Bitcoin Price Finally Hits $8,300, Highest Single-Day Jump In Five Weeks

There are signs of slight bullishness for Bitcoin as it reemerged above the $8,000 level.
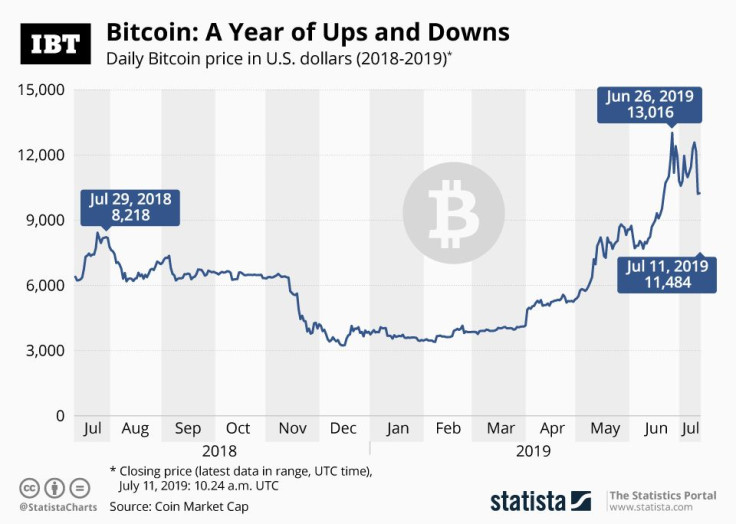
After visiting a low of $7763.54 on Monday, Bitcoin (BTC) capped off its biggest daily gain of 4.47 percent in five weeks. The popular cryptocurrency even traded above $8,200 and went up to as high as $8344.12 on Tuesday.
Traders target the $8,500 level as the next key resistance level.
Still far away from most targets
At the current price, BTC looks very far away from what experts and well-known Bitcoin believers project prices to be.
For instance, German bank Bayerische Landesbank published a September 2019 report about Bitcoin with a price projection of $90,000 by May 2020. The model that they used for valuing BTC is the stock-to-flow approach, which is usually a metric for analyzing precious metals and commodities.
Trader and author Peter Brandt predicted on Sept. 29 that the cryptocurrency would bottom at $5,500 that will lead a bull move to $50,000. John Mcafee, the founder of McAfee Associates, agreed with Brandt but had a more vertiginous forecast -- a $1 million Bitcoin.
Chris, just a wild guess, but I think BTC bottoms at $5500 next Feb and then begins a bull move to $50,000
— Peter Brandt (@PeterLBrandt) September 29, 2019
Zhao Dong, a shareholder of Bitfinex and founder of crypto lending platform RenrenBit, said the crypto market will go up in the next three months. He shared his thoughts on Weibo.
"The next three months could be the last opportunity for bottom fishers, and after that, the crypto market will enter Spring and then Summer, estimated to rally together with China's stock market in 2021."
But with the way Bitcoin is moving at its current pace, it would take massive participation and heightened speculative interest for the cryptocurrency to be on track for the majority of its 2020 projections.
Technical Picture
The 4.47% percent move on Monday printed a bullish candlestick on the daily timeframe that, together with Sunday's standard, almost resembled a textbook bullish engulfing pattern, and it's in an area where a previous downtrend preceded it.
The MACD levels show the MACD line crossed above the signal line, which indicates bullish momentum might be ahead and BTC still trades below the 200-day moving average.
Bitcoin price is currently $8,145.57, according to Coindesk.

© Copyright IBTimes 2024. All rights reserved.


