A Few Charts to Ponder: The Cost of Debt
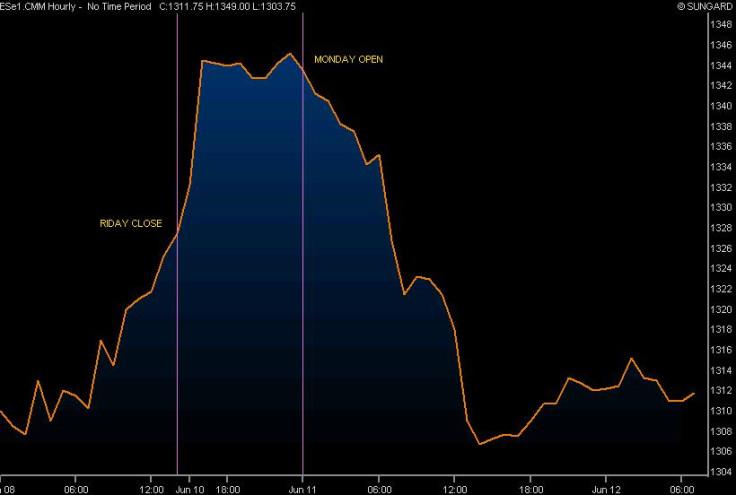
1. S&P 500 Futures contracts. Friday closed on rumours of A Spanish Bailout, which were confirmed over the weekend, prompting a risk rally when Asian markets opened on Sunday evening. And when North America opened on Monday, traders immediately sold everything they could.

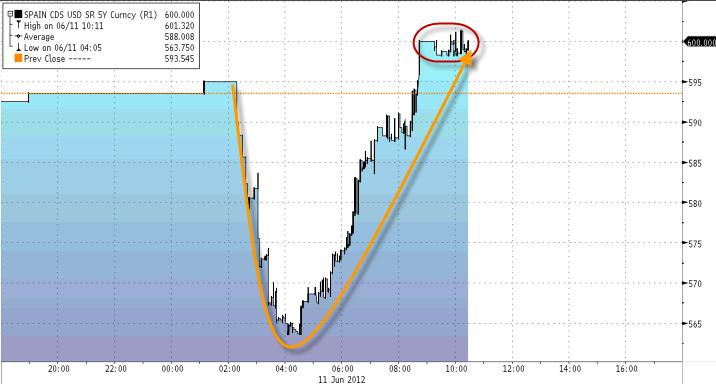
2. The Cost of Debt. This chart represents the cost of insuring Spanish debt against default compared to that of insuring German debt against default. It costs more than 600 points (6% interest rate) to insure Spanish debt compared to its German equivalent. The bailout announcement seems to have done little to boost market confidence in this regard; this spread actually grew wider after the announcement.

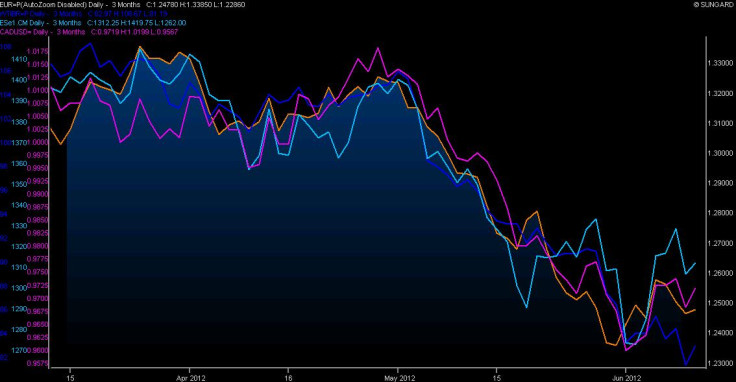
3. All Together Now. The euro (orange), Canadian dollar (pink), S&P 500 (light blue), and oil (dark blue) all trade in lockstep these days, and always in one direction: down. Headlines rule the markets, so beware of quick pullbacks on the slightest good news.


