Full Force Of Central Banks Siphoning World Liquidity: Mike Dolan

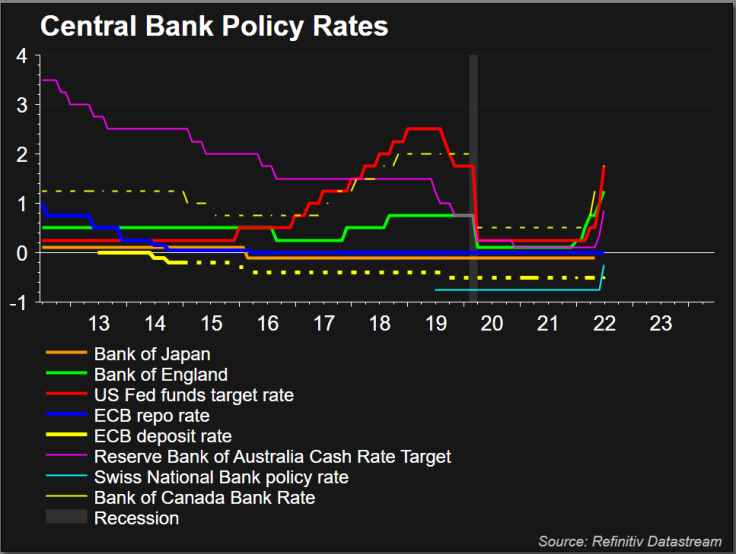
Coordinated or not ahead of this month's G7 summit, global central banks are accelerating interest rate hikes but also actively draining the giant pool of cash swilling around world markets and buoying currencies to stymie imported inflation.
You don't have to be a strict monetarist or liquidity obsessive to see how the scale of this will affect stocks and bonds over the remainder of the year at least.
For many who do focus on the lockstep impact of world liquidity on asset prices, the process has already been underway since late last year and has been the driver of the 20-30% drop in major stock indices since December.
The worrying bit for investors is that it may only be about half-way through and the aggressive tightening unveiled this week shows little trepidation among policymakers right now.
This week's headline grabbing interest rate rises from the U.S. Federal Reserve, Bank of England and Swiss National Bank show new-found determination to get across decades high inflation as quickly as possible while unemployment rates are near historic lows and labour markets remain tight.
The European Central Bank grappled with how to rein in ballooning euro sovereign risk premia as it prepares to raise rates next month for the first in more than a decade. But agreement on the "anti-fragmentation" backstop was seen as a quid pro quo for steeper policy rate rises and markets now price almost 2 percentage points of hikes by the year-end.
The Fed's outsize 75 basis point rate rise was its biggest move in 28 years, with markets now expecting its key rate to more than double from new target range of 1.50-1.75% within a year. Even grappling with a much weaker economy, the Bank of England is also expect to almost double rates to more than 2% from here.
The shock half-point rise in SNB rates on Thursday threw another log on the fire, leaving a lonely Bank of Japan the only one of the major players still pegging short and long-term borrowing rates down.
Technical recessions may now be an inevitable price to pay. Some argue that allowing inflation to stay so high may trigger one anyway by squeezing real incomes and company margins hard.
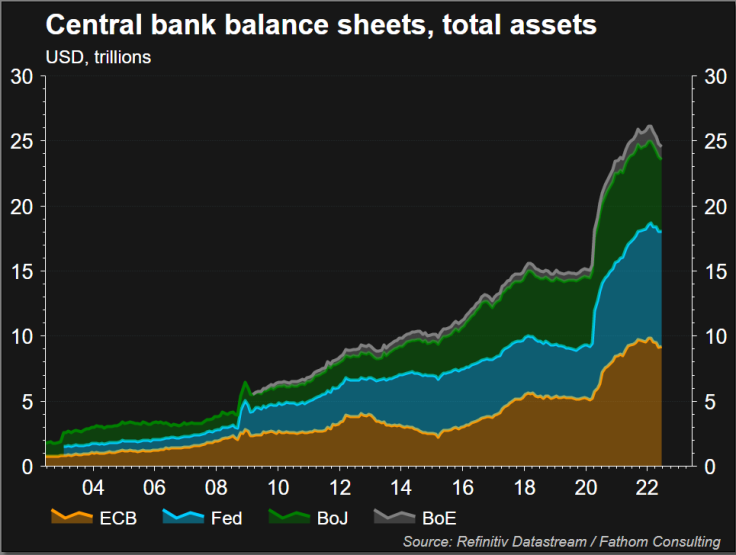
But higher central bank borrowing rates are just one part of the story and the great unwind of central bank balance sheets is arguably a far more direct impact on world markets.
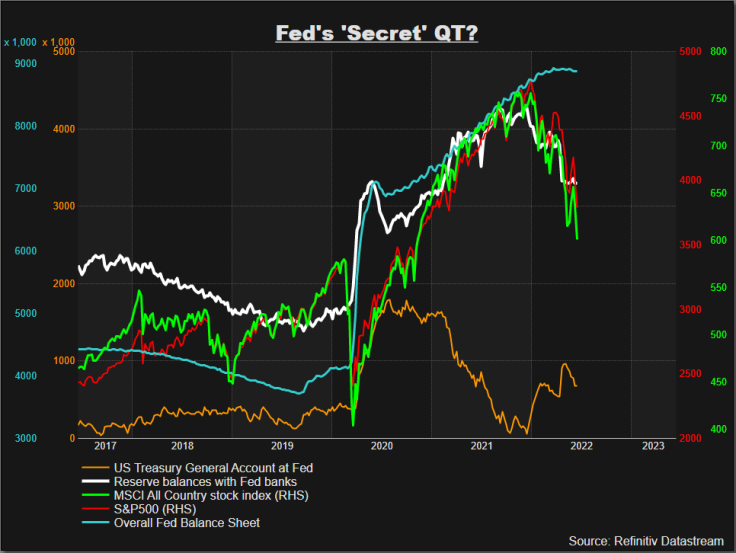
GRAPHIC: Fed balance sheet, bank reserves and stock markets (

)
GRAPHIC: Rising Central Bank Interest Rates (

)
SECRETLY DRAINING
According to liquidity specialists CrossBorderCapital, the annual percentage change in central bank liquidity has already collapsed and is contracting from peak annual expansion rates of about 40% last year.
In note published just before this week's barrage of official rate rises, it stressed that this contraction was underway before this month's start of the Fed's "quantitative tightening" (QT) or next month's ECB equivalent - however messy the latter may be in the light of a new "fragmentation" buster.
And it expected an annual contraction of up to 10% to persist for the next two years.
The Fed's contribution to the fabled punchbowl this year is a case in point.
Even though its overall balance sheet brims at well over $8 trillion on the eve of QT, commercial bank reserves held at the Fed - a flipside of balance sheet assets and where the real liquidity to world markets comes from - have dropped by almost $1 trillion since December as U.S. Treasury's account at the Fed refilled.
And that's before some $1-$2 trillion of overall balance sheet reduction comes down the pike over the next 18 months.
Claiming the Fed has been "secretly shrinking liquidity injections" this year, CrossBorderCapital sketches how the confluence of reduced Treasury bill sales and rising Fed rates draws more and more of that money into Fed reverse repurchase operations - currently running at more than $2 trillion nightly.
That further shrinks the "effective Fed balance sheet" and that could now halve by 2025 due the combination of outright balance sheet decline and the draw of reverse repos.
"A rising tide may well float many boats, but a tsunami of monetary tightening unquestionably sinks asset markets," it concludes.
While this may appear like arcane accounting, the shift in these liquidity measures tallies uncannily with market pricing.
Beyond the Fed, the ECB picture may seem messier. But BoE balance sheet reduction is also due and the SNB's surprise rate hike rates sees it embrace a strong Swiss franc to dampen imported inflation and likely stop its FX-related balance sheet accumulation of global stocks and bonds.
What's more, the aggressive turn in Fed tightening promises even more dollar strength ahead, forcing other central banks into similar tightening for fear of exaggerating their inflation pictures with ever higher dollar-based energy and food imports as well as tightening borrowing conditions for emerging markets.
"The last decade was a race to the bottom in currency wars globally, with lacklustre inflation dynamics, but the mood music has now changed," said Charles Hepworth, Investment Director at GAM Investments.
GRAPHIC: Central Bank Balance Sheets (

)
The author is editor-at-large for finance and markets at Reuters News. Any views expressed here are his own
(by Mike Dolan, Twitter: @reutersMikeD; editing by David Evans)
© Copyright Thomson Reuters 2024. All rights reserved.


