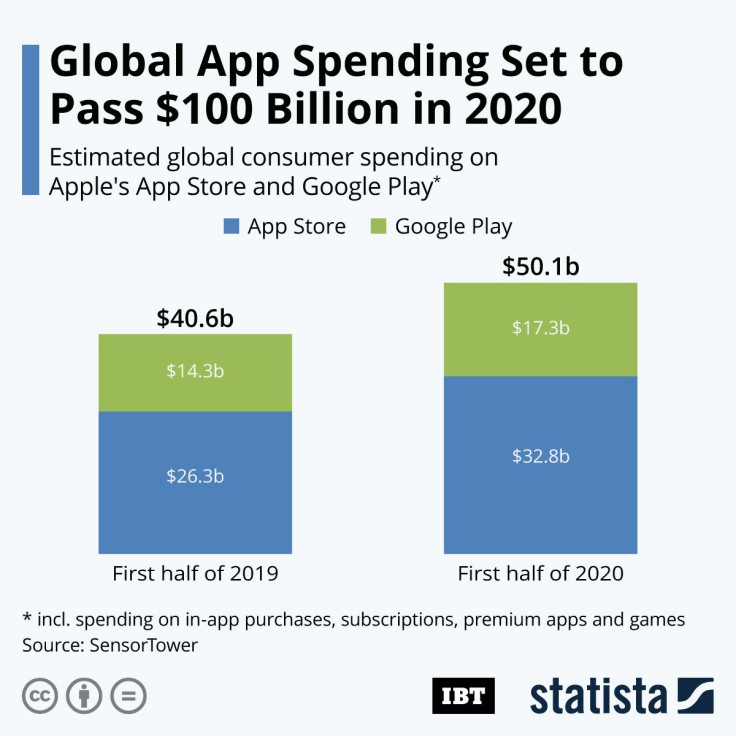
Infographic: Global App Spending Set To Pass $100 Billion This Year

Faced with antitrust allegations and the wrath of (some) app developers, Apple decided to go on the offensive once again last week. For the second time in as many months, the company commissioned an “independent” study from the Analysis Group, in a not too well concealed attempt to shape the public opinion on its App Store practices.
Back in June, just in time for its annual Worldwide Developers Conference, Apple had touted the results of a study gauging the economic impact of the App Store ecosystem, which had found that the App Store supported $519 billion in billings and sales last year, of which Apple only saw a small percentage. Last week another study from the Analysis Group compared Apple’s widely criticized commission practices to those of the competition, finding that “Apple’s App Store commission rate is similar in magnitude to those of other app stores and digital content marketplaces.”
Apple charges a 30% commission on app sales, in-app purchases of digital content and subscriptions made via iOS apps (the latter dropping to 15% after the first year), which has drawn the attention of competition watch dogs, especially in cases where Apple competes with third-party app makers (e.g. Apple Music vs. Spotify).
While some people might be surprised that Apple, a hardware company, puts up that much of a fight to keep its commission structure in place, the following chart helps explain the company’s determination to keep the status quo. According to app analytics firm SensorTower, consumer spending on Apple’s App Store and Google Play passed $50 billion in the first half of 2020, with two-thirds of that total spent on the App Store. Assuming most of that total qualifies for Apple’s commission, that amounts to roughly $10 billion in revenue in the first six months of 2020 alone, which even for Apple is no small change.


