Infographic: How Uber and Lyft Performed in 2018

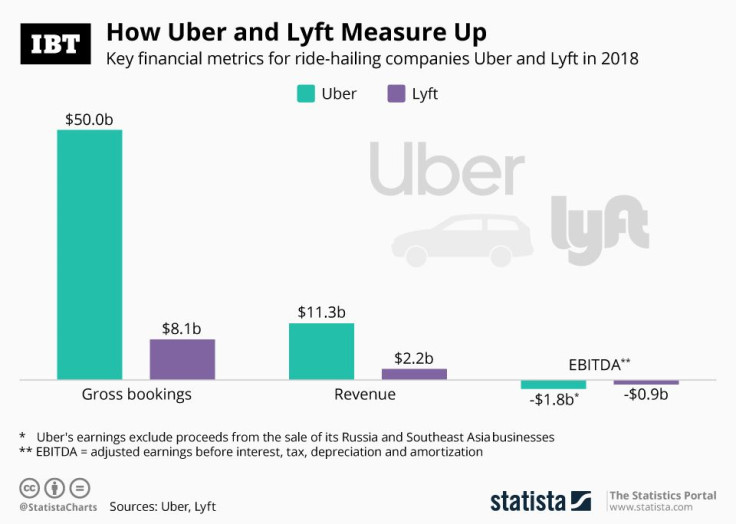
Ride-hailing company Lyft filed the paperwork for its initial public offering last Friday, lifting the veil on how its fast-growing business is performing financially. According to the filing, 30.7 million people hitched a ride with one of the 1.9 million drivers offering their services on Lyft’s platform last year. Total bookings, i.e. the total amount paid by passengers before deducting the drivers’ share and other expenses amounted to $8.1 billion in 2018, up from $1.9 and $4.6 billion in 2016 and 2017, respectively. Lyft’s actual take was considerably smaller than that though at $2.1 billion, while its losses for 2018 piled up to more than $900 million.
As our chart illustrates, these numbers make Lyft the smaller of the two dominant ride-hailing companies in the United States. Uber, which operates in more international markets than its main competitor does, generated $50 billion in gross bookings last year, with revenues amounting to $11.3 billion. What both companies have in common is the fact that they’re losing money at a worrying rate. Uber lost roughly $1.8 billion in 2018, posing the question whether the ride-hailing business model is sustainable in the long run.
In recent years shared mobility services have gained prominence in the United States and elsewhere as more and more people realized that owning a car is inefficient for most, especially in chronically congested metropolitan areas. Lyft is reportedly looking for a valuation of $20 to $25 billion in its upcoming IPO, while Uber, also expected to go public this year, could seek a valuation between $70 and $100 billion in what would be one of the largest IPOs in history.


