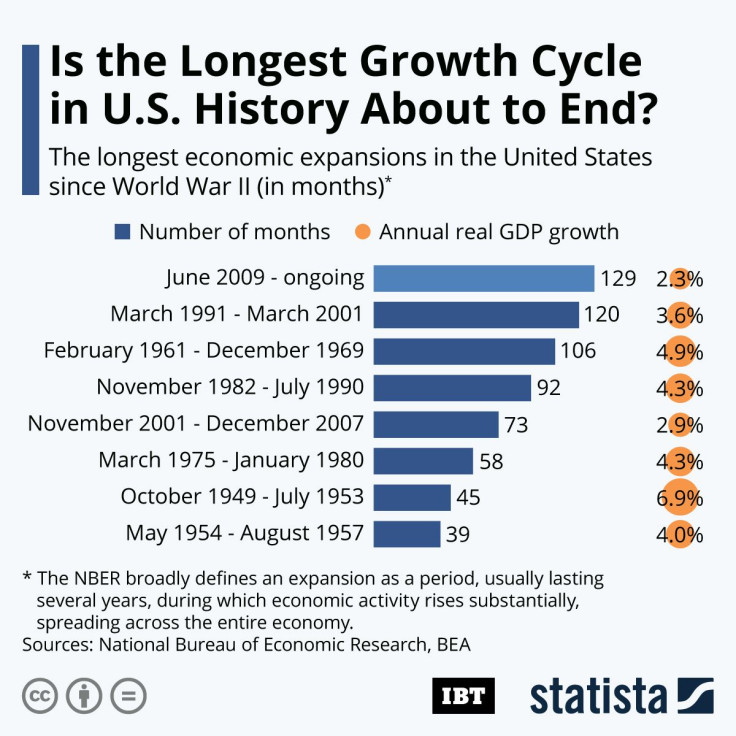
Infographic: Is The Longest Growth Cycle In US History About To End?

On September 20, 2010, the National Bureau of Economic Research (NBER), the semi-official chronicler of economic cycles in the United States, announced that June 2009 marked a trough in business activity signaling the end of the recession that began in December 2007 and the beginning of an expansion. Identifying the date of a trough/peak in economic activity is a complex task carried out by the Business Cycle Dating Committee, a panel of 10 renowned economic researchers, that involves weighing the behavior of various indicators to pinpoint turning points in economic activity as accurately as possible.
Ever since the September 2010 announcement, the Committee has been remarkably quiet, mainly thanks to the fact that the expansion that started in June 2009 is still ongoing and officially became the longest growth cycle in the history of the United States in July 2019. As the coronavirus continues to spread in the United States and worldwide, fears of a global recession are mounting, however, threatening to end the unprecedented growth streak. Even if the outbreak hits the world economy significantly, the U.S. might still avoid sliding into a recession though. Compared to the euro area, which has been drifting towards recession before the outbreak, the U.S. economy looks robust, and the fact that the Fed still has room to cut rates could prove crucial in preventing a downturn.
As the following chart shows, the current expansion is the longest ever, trailed by the growth cycle that lasted from March 1991 to March 2001 and culminated in the bursting of the dot-com bubble. As oppossed to many shorter growth periods of the past, the current expansion is one of moderate growth. With an average annual GDP growth of 2.3 percent, the ongoing upturn is in fact the second slowest since the end of World War II.


