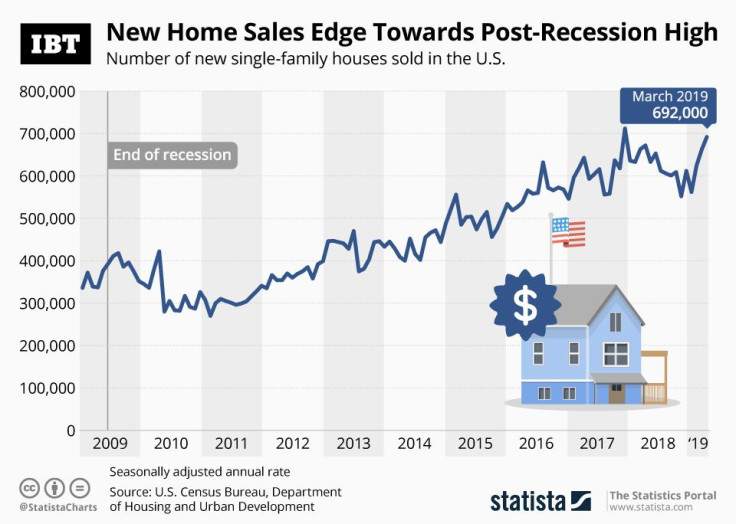
Infographic: New Home Sales Surge To A 16-Month High

Sales of new single-family houses unexpectedly rose to a 16-month high in March. According to figures jointly released by the U.S. Census Bureau and the U.S. Department of Housing and Urban Development, new home sales climbed to a seasonally adjusted annual rate of 692,000, the highest level since November 2017 (712,000) and the second highest since the end of the recession that followed the burst of the housing bubble.
The rise in new home sales, which account for roughly 10 percent of the housing market, coincides with a decline in the median sales price, which dropped to $302,700 in March, the lowest level since February 2017. The drop can largely be attributed to an increase in the share of lower-priced homes being sold, with houses priced below $299,999 accounting for 50 percent of total sales in March, up from 39 percent in March 2018. According to Tuesday’s release, 344,000 homes were for sale at the end of March, virtually unchanged from 345,000 a month earlier.
While new home sales are on the uptick, existing home sales declined by 5.4 percent year-over-year in March to a seasonally adjusted annual rate of 5.21 million. According to the National Association of Realtors, the median price for all existing home types increased to $259,400 in March, marking the 85th consecutive month of rising prices for existing homes.


