Infographic: Stocks Emerge From COVID Crash With Historic 12-Month Run

Historically high unemployment, a steep economic downturn and, at the root of it all, a global health crisis claiming millions of lives – for large parts of 2020, the bad news kept rolling in, and yet, the stock market has rallied through the past 12 months like rarely before.
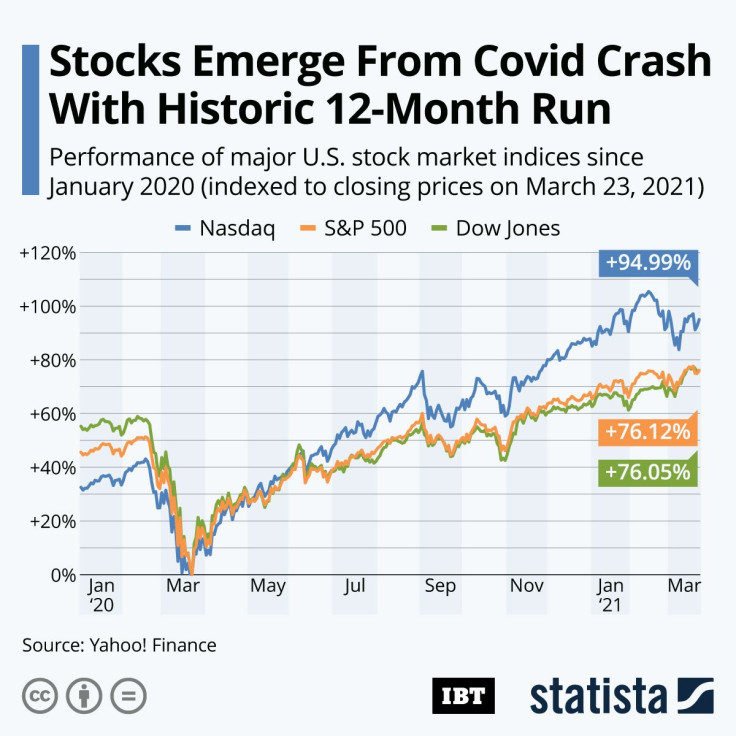
Exactly one year ago, on March 23, 2020, the U.S. stock market hit rock bottom after the coronavirus outbreak had led to a turbulent month with wild swings in both directions, resulting in 30+ percent drops for each of the three major stock market indices from their previous peaks. 12 months later, the world is still in crisis, but stock prices are near all-time highs.
So why did the stock market crash at the outset of the pandemic only to recover once the actual fallout became visible? For one thing, some companies, including large-cap ones like Apple, Amazon and Microsoft were spared from the pandemic’s fallout and, if anything, even profited from it. Secondly, fiscal stimulus of historical scale not only limited the drop in consumer spending but left many people unaffected by the crisis with cash to invest in the stock market. And ultimately, once it became clear that vaccines would be available sooner than originally expected, a sense of optimism spread like wildfire among investors.
As the following chart shows, all three major U.S. stock market indices bottomed out on March 23, 2020. Since then, the Dow Jones, S&P 500 and Nasdaq have soared 76, 76, and 95 percent, respectively, making the past 12 months one of the best 365-day stretches since World War II.


