Maps And Graphs Explain Why The US Is World's Largest Producer Of Hydrocarbons

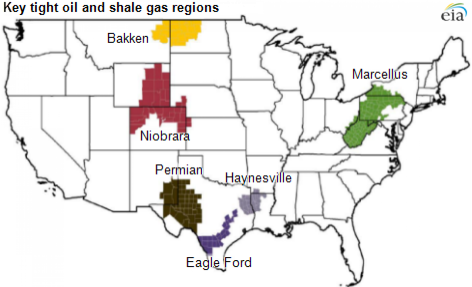
The U.S. petroleum production boom is taking place across several regions where the use of hydraulic fracturing in combination with horizontal drilling is allowing the U.S. to overtake Russia and even oil-rich Saudi Arabia to become the world's largest producer of hydrocarbons, according to a recent report by Pira Energy Group.
The rapid increase in U.S. crude oil and natural gas output can be attributed to the extraction of the commodities from shale formations. This has contributed to the U.S. producing 14 percent more of its own energy now vs. 2005, according to the U.S. Energy Information Administration (EIA).
A new "Drilling Productivity Report" from the EIA, which was released Tuesday, offers a peak into regions that sparked the surge in production.
Fracking is a drilling technique that blasts millions of gallons of water and chemicals to fracture rock formations deep beneath the surface and release petroleum. The drilling technique has been heavily criticized, and some environmentalists contend that it contaminates groundwater.
Below are charts pertaining to the Bakken formation, which extends from parts of Saskatchewan, Canada, into Montana and North Dakota. The chart shows estimates of how much oil is expected to be produced from new wells per average rig for the current and following months.

The top-left chart provides estimates of how much oil was or is expected to be produced from new wells per average rig in the region for the current and following months, as well as the month-over-month change. This estimates are indicators of rig productivity and take into account both the time it takes to drill a new well and the productivity of that well. The top-right chart presents corresponding rig productivity estimates for natural gas.

The total rig count (the same in both graphs) in the Bakken formation and new well production per rig from the start of 2007 through the estimates for the current and following month.

The the total monthly production within the Bakken region from the start of 2007 through the estimates for the current and following month. Production reflects all wells reported to state oil and gas agencies or EIA estimates in cases where state data are not immediately available.
Take a look at other regions that are contributing to the boom in the report here.
© Copyright IBTimes 2024. All rights reserved.


