SectorWise: Cyclical Stocks Hot, Utility Stocks Not In First 11 Months Of 2012

U.S. equities did reasonably well in the first 11 months of this year, as is evident by the increases in multiple stock-market indexes.
The multicapitalization Nasdaq Composite (COMP) rose 15.55 percent, to 3,010.24 from 2,605.15; the large-capitalization Standard & Poor's 500 (SPX) rose 12.29 percent, to 1,412.18 from 1,257.60; and the megacapitalization Dow Jones Industrial Average (DJI) rose 6.61 percent, to 13,025.58 from 12,217.56.
New Year's Day is only a trading month away, so market operators are looking forward and looking backward in about equal measures at this time of year. Past performances are no guarantee of future results, but they can help participants appraise the continuous feedback loop between the economy and the financial markets.
One approach to this appraisal centers on sector rotation, which was covered in Sam Stovall's "Standard & Poor's Sector Investing: How to Buy The Right Stock in The Right Industry at The Right Time" and is discussed at StockCharts.com.
Employing exchange-traded funds known as Select Sector SPDRs that divide the S&P 500 into nine sector index funds, an observer of sector rotation believes he or she can find clues to future stock-market moves in past stock-market moves.
These nine ETFs are listed on NYSE Arca, and their names and tickers are as follows:
-- Consumer Discretionary Select Sector SPDR Fund (XLY);
-- Consumer Staples Select Sector SPDR Fund (XLP);
-- Energy Select Sector SPDR Fund (XLE);
-- Financial Select Sector SPDR Fund (XLF);
-- Health Care Select Sector SPDR Fund (XLV);
-- Industrial Select Sector SPDR Fund (XLI);
-- Materials Select Sector SPDR Fund (XLB);
-- Technology Select Sector SPDR Fund (XLK); and
-- Utilities Select Sector SPDR Fund (XLU).
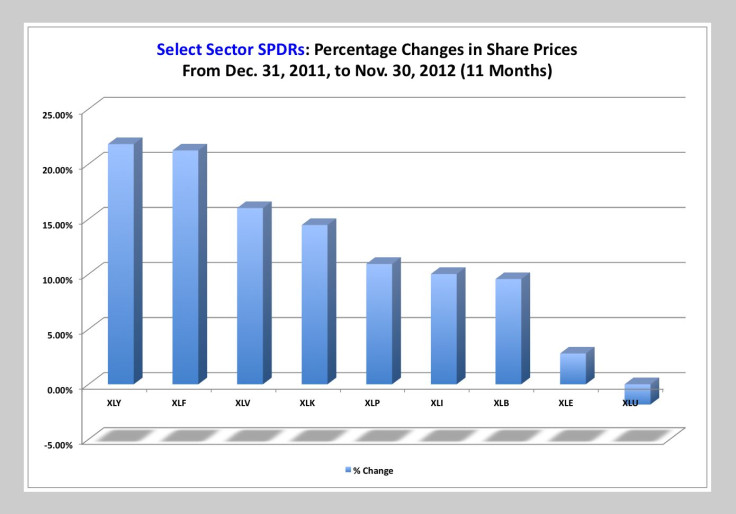
Year to date, the consumer-discretionary, or cyclicals, SPDR has risen 21.81 percent, while the utilities SPDR has fallen 1.83 percent, as noted in the chart accompanying this article.
The disparity between these performances is interesting to an observer of sector rotation, who would note the beta of XLY is comparatively high at 0.91 and the beta of XLU is comparatively low at 0.28. The beta of an ETF, equity, or portfolio is a figure describing the correlated volatility of an asset in relation to the volatility of its benchmark, in this case the S&P 500.
Therefore, such an observer might reasonably conclude -- based on the fact higher-beta stocks (as represented by XLY) have done better have lower-beta stocks (as represented by XLY) -- that market participants have been more in risk-on mode and less in risk-off mode to this point in 2012.
The only issue now is whether this trend will continue another week, another month, or another year before its reversal.
© Copyright IBTimes 2024. All rights reserved.


