State Of The Union 2016: How The Economy Has Fared Since Barack Obama Took Office

President Obama delivers his final State of the Union address Tuesday evening. When he first addressed a joint session of Congress in 2009, the U.S. economy was in a very different place. With the global financial crisis still reverberating, employers were shedding upward of 700,000 jobs a month as millions of Americans entered home foreclosure.
Since then, the economy has regained its footing, and unemployment levels have approached pre-crisis levels. Still, wages for many Americans have yet to grow substantially, and job growth has tilted toward low-wage service sector jobs.
Of course, presidents cannot take full responsibility — or blame — for the broader fluctuations of business and employment cycles. But when Obama takes the stage Tuesday night, he will be able to point to two starkly different economies to describe the path his presidency has taken. Below are five key economic indicators from the Obama era.
Jobs
The economy lost 8.7 million jobs between the official start of the recession in late 2007 and early 2010. But by 2014 the economy had added all those jobs back, and today payrolls count 14.1 million more employees than in February 2010. After more than 60 consecutive months of job gains, the U.S. unemployment rate has halved from a peak of 10 percent seen in October 2009.
Wages
The flip side of the employment picture is wages. Since 2010, annual wage growth has averaged just 2 percent, compared with a 20-year average of 3 percent. Among other factors, economists point to a historically high number of potential workers sitting on the sidelines of the labor force. That slack likely has kept the pressure off employers to raise wages.
Economic Growth
U.S. gross domestic product took a major hit during the financial crisis, falling 8.2 percent in the final months of 2008 after a two-decade stretch that never saw more than a 3.4 percent contraction. Since the recession, inflation-adjusted GDP gains have averaged 2.1 percent, compared with a 20-year average of 3 percent previously.
The Housing Market
Crucial to the economic recovery was a rebound in homebuying, facilitated by government housing policies aimed at getting Americans out from under foreclosed and underwater homes. Though sales of existing homes haven’t returned to levels seen during the mid-2000s bubble, Americans are now once again buying and selling houses as frequently as they did in the 1990s.
Inequality
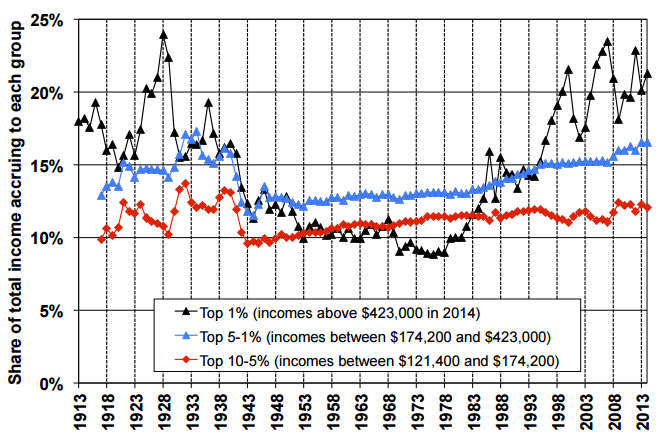
The shock of the financial crisis brought newfound public attention to the growth of income and wealth inequality, sparking the rise of the Occupy movement in 2011 and the presidential campaign of Sen. Bernie Sanders, D-Vt.
Those trends have not abated during Obama's time in office. Between 2009 and 2014, the average income advanced 8.4 percent, while those for the top 1 percent of earners increased 27 percent, data compiled by economist Emmanuel Saez show. During that time, the top sliver captured 58 percent of wage growth.

© Copyright IBTimes 2024. All rights reserved.


