Stock Market Bulls Eye Technical Signal For Further Gains

Some stock market bulls are watching a technical indicator for clues on whether a summer rebound in U.S. equities will roll on.
The S&P 500 is up 15% from its mid-June low, a rally that gained even more momentum after Wednesday's U.S. inflation data showed consumer prices unchanged for July. This bolstered the case for the Federal Reserve to end its market-bruising rate hikes sooner than previously expected.
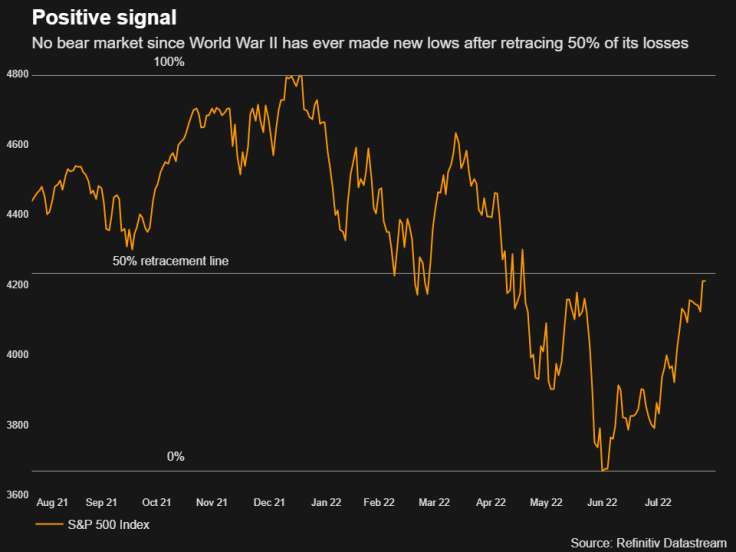
The stock surge, which has delivered the S&P's best eight-week period in more than a year, has brought the index within sight of a 50% retracement of its bear market loss.
Traders are watching the 4,231 level for the S&P 500. Hitting that would mean the benchmark index will have recouped half the losses logged since the drop from its January high.
"In my studies taking out 50% is bullish," Nargis Motorwala, an independent trader based in the San Francisco Bay Area, said.
But the lack of a decent pullback for the S&P 500 in recent weeks, makes it worth treating the signal with caution, she said.
To trigger the signal the S&P 500 has to close above 4,231, Jonathan Krinsky, chief market technician at BTIG, said in a note.
While that does not promise more gains, it could mean the bear market has bottomed if history is any guide.
"Since WWII, every time the S&P recovered 50% of the bear market price decline, while the 500 may have re-tested the prior low, it never set a lower low," Sam Stovall, chief investment strategist at CFRA Research, said.
GRAPHIC: Positive signal:

A close above that level does not necessarily imply an end to near-term weakness for stocks.
"Prior 50% retracements in 1974, 2004 and 2009 all saw decent shakeouts shortly after clearing that threshold," Krinsky said.
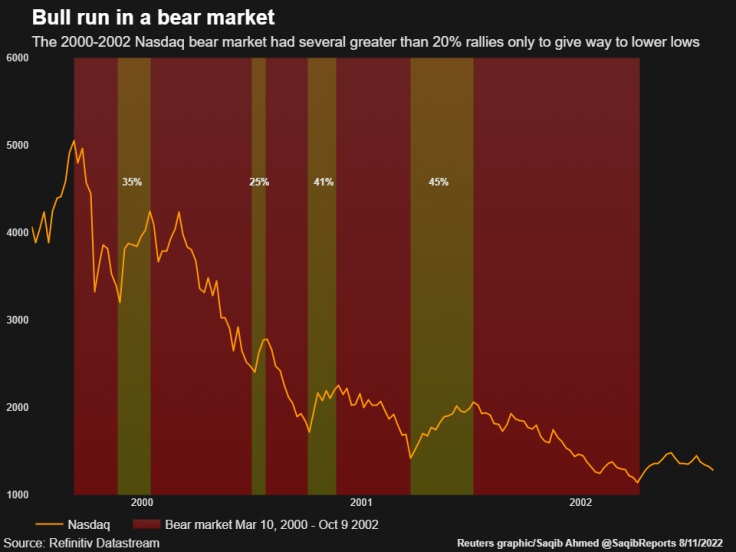
GRAPHIC: Bull run in a bear market:

Stocks' big advance in recent weeks, particularly for beaten down technology and other growth names, has lifted the Nasdaq Composite more than 20% above its recent low, raising hopes for a brief bear market.
Views differ on how to spot an expiring bear market or a new bull market. Some define a bull market as a 20% rise from a previous low. Others say investors can only be sure of a new bull market once a record high has been reached.
Fierce stock bounces can occur within a broader bear market.
For instance, the 2000-2002 bear market for the Nasdaq logged several greater-than-20% rallies: all but one of them faded to make way for lower lows for the index.
Stock market bulls, however, have something else to celebrate.
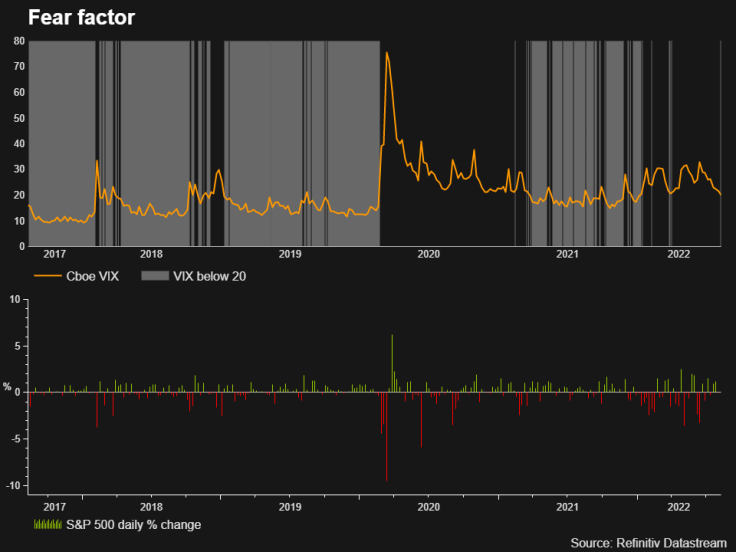
GRAPHIC: Fear factor:

The strong U.S. stock market rally has crushed measures of investor anxiety to multi-month lows, with the Cboe Volatility index on Wednesday logging its first close below the 20 level in nearly 4 months.
The VIX, an options-based indicator that reflects demand for protection against drops in the stock market, recently stood just above the 20 mark, a level generally associated with a moderate investor anxiety about the near-term outlook.
The retreat in the VIX coincides with a marked drop in daily stock market gyrations over the last few weeks and as such bodes well for the market.
Since 1990, on average, the S&P 500 has gained 0.11% on any day the VIX has closed below the 20 level, compared with an average decline of 0.08% for those days when the index close above the 20 mark, according to a Reuters analysis.
© Copyright Thomson Reuters 2024. All rights reserved.


