Twitter IPO: How Does Twitter Compare Against Facebook, LinkedIn And Other Social Media Companies [Charts]
This may be an odd time for Twitter to go public. In lifting the veil on its financial performance as part of its planned IPO, Twitter announced that while sales are improving, losses persist. In its Securities and Exchange Commission filing, Twitter reported $317 million in revenue in 2012, up from $106 million in 2011, and net losses of $80 million in 2012, an improvement over a $164 million shortfall in 2011.
So things are looking up? Maybe not. In the first six months of 2013, Twitter's losses increased by 41 percent compared to the same period the year before, to $69.3 million. The social media company is spending more than twice as much on sales and marketing as it did last year. And research and development costs are multiplying quickly as well.
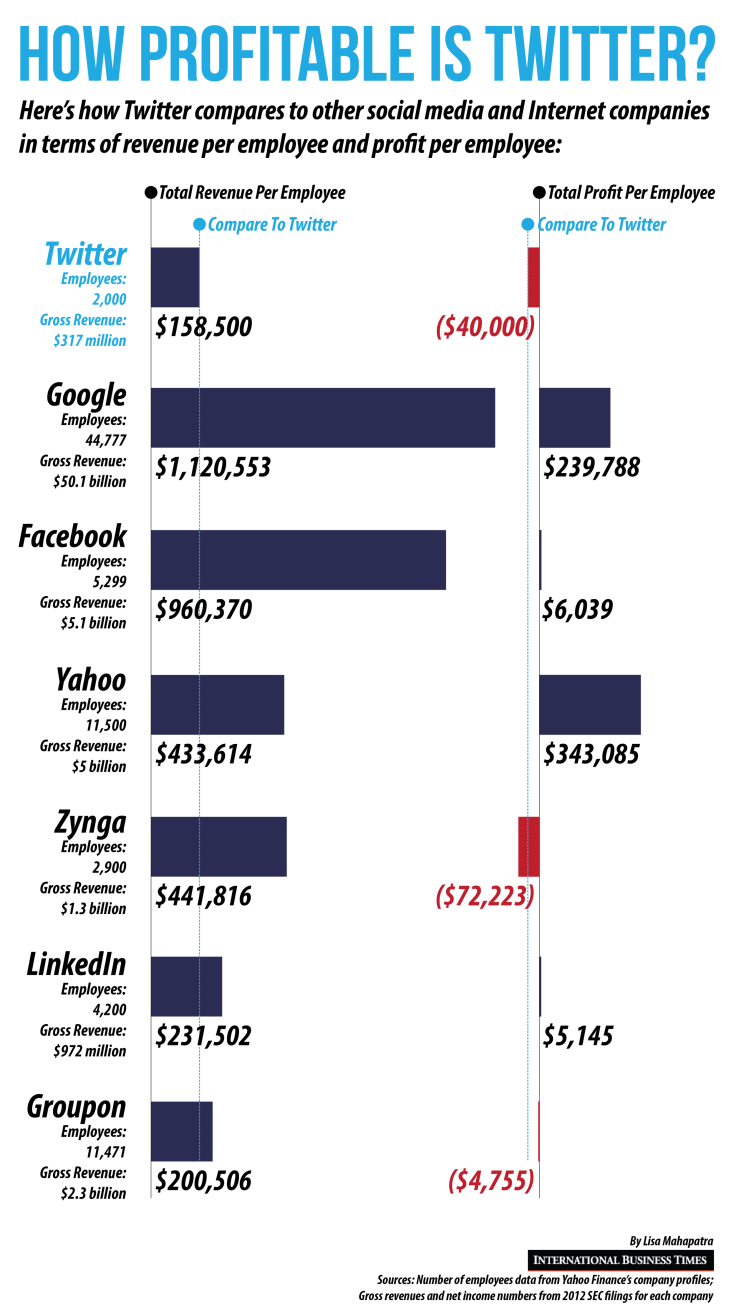
This troubling picture becomes even more disconcerting when Twitter's operating performance ratio is examined. By this metric, which compares how much money a company makes against how many people it employs, Twitter is in much worse shape than comparable social media and Internet companies like Facebook (NASDAQ:FB) and LinkedIn (NYSE:LNKD). Most analysts say that operating performance ratio is a good indicator of a company's efficiency.
Twitter reported $158,500 in revenue for each of its 2,000 employees in 2012. In comparison, Facebook took in $960,370 per employee, while LinkedIn's sales equaled $231,502 per employee. Twitter lost $40,000 per employee in 2012.
This chart compares Twitter's revenue per employee and profit per employee against those of six other publicly held social media and Internet companies:

© Copyright IBTimes 2024. All rights reserved.


