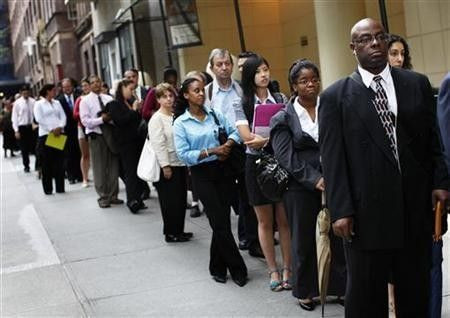
Jobless Claims Fall to 372,000; U.S. Labor Market Starts '12 on a Stronger Footing Despite Worries

The number of Americans filing for first-time unemployment benefits resumed its downward trend last week after an uptick in the week ended Dec. 24. But the figure remained below a key threshold for gauging the job market, a sign that the labor market is gaining strength.
The Labor Department said new claims in the week ended Dec. 31 decreased by 15,000 to 372,000. Jobless claims have registered below the key 400,000 mark -- a level historically associated with an improving labor market -- in eight of the past nine weeks. Economists polled by Reuters called for a decrease of 6,000.
Thursday's data showed the four-week moving average, considered a less volatile measure of the labor market trends, came in at 373,250, a decrease of 3,250 from the previous week's revised average of 376,500, and the lowest level in more than three years.
Continuing claims -- which include people filing for the second week of benefits or more -- fell by 22,000, to 3,595,000 in the week ended Dec. 24.
The continuing claims figure does not include the number of Americans receiving extended benefits under federal programs.
The 4-week moving average was 3,601,750, a decrease of 1,000 from the preceding week's revised average of 3,602,750.
Some Bad News
Greater attention is being paid to unemployment figures due to this year's presidential election, especially since no U.S. president since Franklin Delano Roosevelt has won a second term when unemployment on Election Day topped 7.2 percent.
Not all has been bad news: the unemployment rate dropped to 8.6 percent in November and Thursday's jobless claims came in positive.
Ahead of Friday's closely watched unemployment rate report, two key trends have emerged from labor market data.
1. A lower labor participation rate (Chart)
The unemployment rate, the normal mechanism for understanding the percentage of workers who want to work but can't find work, is telling us less and less each month.
When the recession officially started in December 2007, the labor participation rate was at 66 percent and the unemployment rate was at 5 percent.
By the time the recession officially ended in June 2009, the labor participation rate dropped to 65.7 percent. The unemployment rate at that time spiked to a high of 9.5 percent (the peak came four months later and registered at 10.1 percent).
Helped by an even lower labor participation rate of 64 percent in November 2011 (the latest figure available) as more people gave up hope to look for a job, the unemployment number edged down to 8.6 percent in November -- the lowest level since February 2009.
Those who have dropped out of the workforce may be encouraged by positive headlines (if 2012 can surprise us) to believe there finally are jobs available and resume their job search activities. By that time, their activity will categorize them in the unemployment section in future months, which could drive the official unemployment rate back up.
2. Only 58 percent of the 16 years and older population are employed (Chart)
The measured unemployment rate has trended down for a while, but it's basically a result of the reduced number of people actively searching since the unemployment rate is calculated by dividing the number of unemployed individuals by all individuals currently in the labor force.
A better gauge would be the employment-population ratio for workers (16 years old and above). Though this number could be somewhat affected by changing demography, it is still capable of telling the bigger picture.
Employment to population ratio fell off a cliff during the recession and has remained relatively flat at that level since 2010.
3. Average length of unemployment at all-time high (Chart)
The average unemployed person in the U.S. has been looking for work for 41.1 weeks, or more than 10 months. That is the longest average unemployment spell since the Labor Department started keeping track in 1948.
Although the Labor Department changed the way it calculates this number in January 2011, workers still had the toughest time finding jobs.
To adjust to the unprecedented rise in the number of people with very long durations of unemployment during the recent labor market downturn (nearly 11 percent of unemployed people had been looking for work for about 2 years or more in the fourth quarter of 2010), BLS updated the Current Population Survey to accept reported unemployment durations of up to 5 years, compared with 2 years in the past.
With people remaining unemployed for longer durations, consumers would become nervous to spend and the government finances would be negatively impacted with additional debt burden in the long-term.
4. More people are out of work for longer terms (Chart)
Over the course of more than 40 years, the percentage of people who are out of work and looking for jobs for 27 weeks and over saw a significant jump, while the percentage of those who has been job searching for less than 5 weeks trended downward.
5. Among those who have jobs, more are settling for part-time gigs (Chart)
Since the winter of 2007, the number of people who are employed part-time because they can't get full-time jobs has been on the rise.
This is referred to as underemployment, which means the employment situation is insufficient in some important way for the worker, relative to a standard. Examples include holding a part-time job despite desiring full-time work, and over-qualification, where the employee has education, experience, or skills beyond the requirements of the job.
© Copyright IBTimes 2024. All rights reserved.


