United States Of Taxation 2014: Here Are The Best And Worst States For Consumption Taxes, Total Tax Burden


Nothing is certain except death and taxes, but taxes can be far more complicated than death.
As the April 15 tax filing deadline approaches, two groups have released data sets that can offer insight into which states are the most forgiving (or punishing) when it comes to consumption taxes and overall local tax burdens.
The nonpartisan Tax Foundation and the personal finance info provider Wallet Hub on Tuesday each released their 2014 data on state taxes. Comparing the two data sets can show you the effect of state, local and sales taxes on your personal bottom line and might help you decide what part of the country to move to if you want lower costs of living and doing business.
“One thing that's important to remember here is that state and local tax rates are only part of the total sales tax story,” said Tax Foundation spokesperson Richard Borean by email. “Equally important are sales tax bases — what the tax applies to — which can have a palpable impact on how much the tax collects in revenue and how the tax affects the economy.”
The data from Evolution Finance Inc.’s Wallet Hub offers further insight into the Tax Foundation’s data that can help put into context what a low or high sales tax means compared to a state’s overall tax burden.
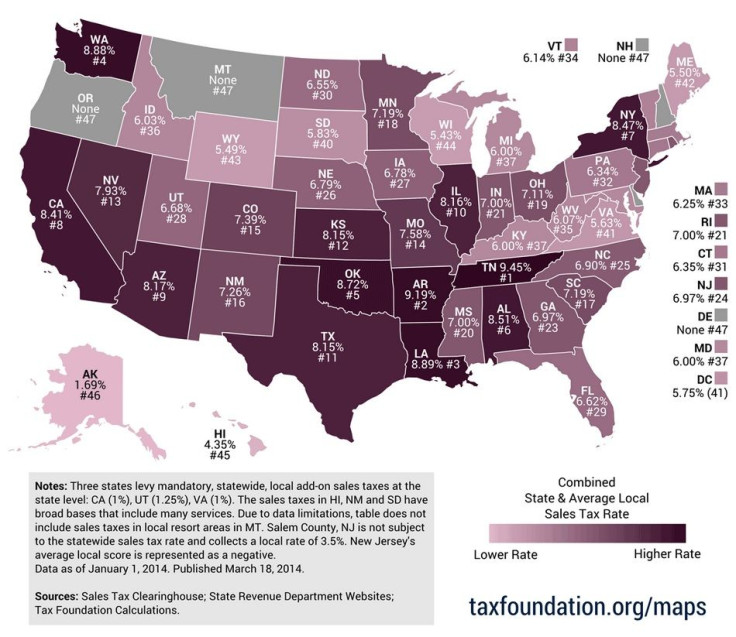
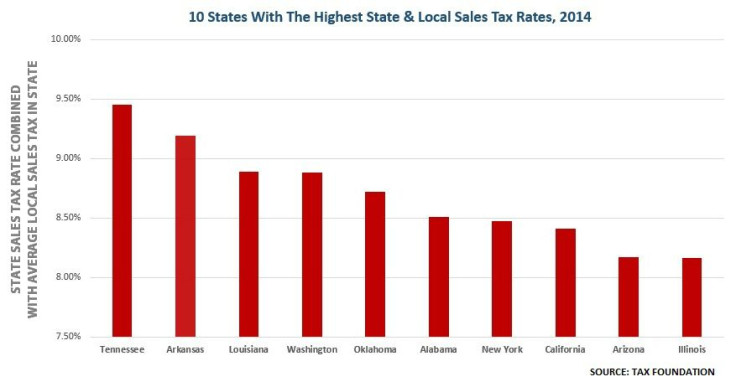
For example, Oregon joins New Hampshire, Montana and Delaware in having no sales tax, according to the Tax Foundation finding, but it has the 12th-highest total tax burden, or 21 percent above the national average of the 50 states and the District of Columbia, according to the Wallet Hub research. Likewise, Tennessee has the nation’s highest sales tax average (state and local), but is almost on par with the national average total state tax liability per household of about $6,990 per year.
Obviously other factors are in play when it comes to quality-of-life issues. States with low tax rates typically offer fewer public services and may be offsetting lower tax revenue by starving their education and public health systems. But if taxes are your primary quality-of-life concern, then forget about New York City and consider Cheyenne, Wyo.
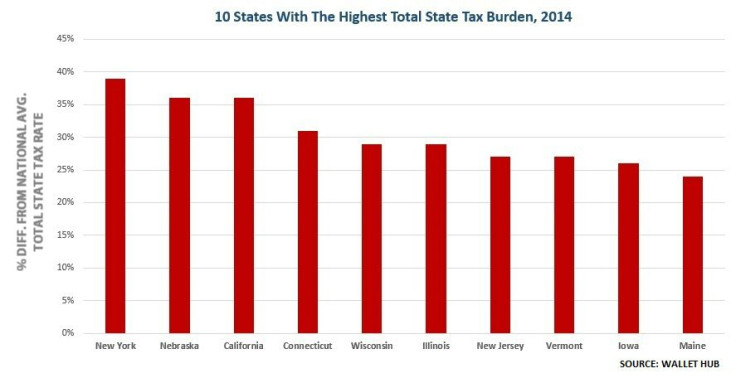
Here are the top 10 states for both average state and local tax rates (top chart) and the total tax liability compared to the national average (bottom chart). For example, New York is the most expensive state in the nation in terms of average total state and local taxes per household, at 39 percent above the national average:


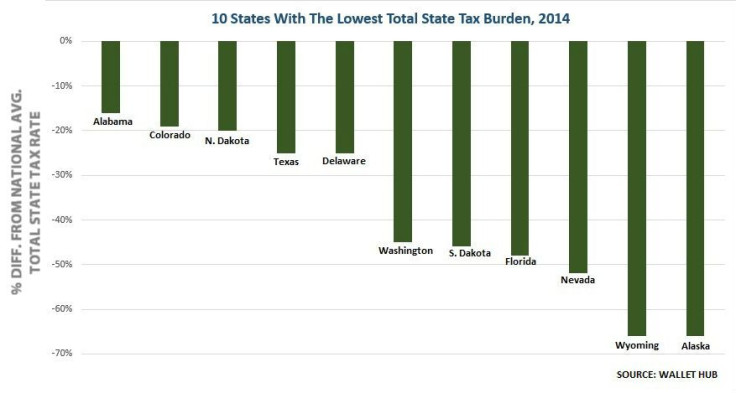
Here are the bottom 10 states for both average state and local tax rates (top chart) and the total tax liability comared to the national average (bottom chart):


Here’s Wallet Hub’s latest estimate of states’ total tax burdens:
© Copyright IBTimes 2024. All rights reserved.


