US Income Inequality: How Much Debt Could Be Paid With Earnings Of Top 1%? [INFOGRAPHICS]


Ever wondered how far the wealth of the nation’s top 1 percent of earners could stretch?
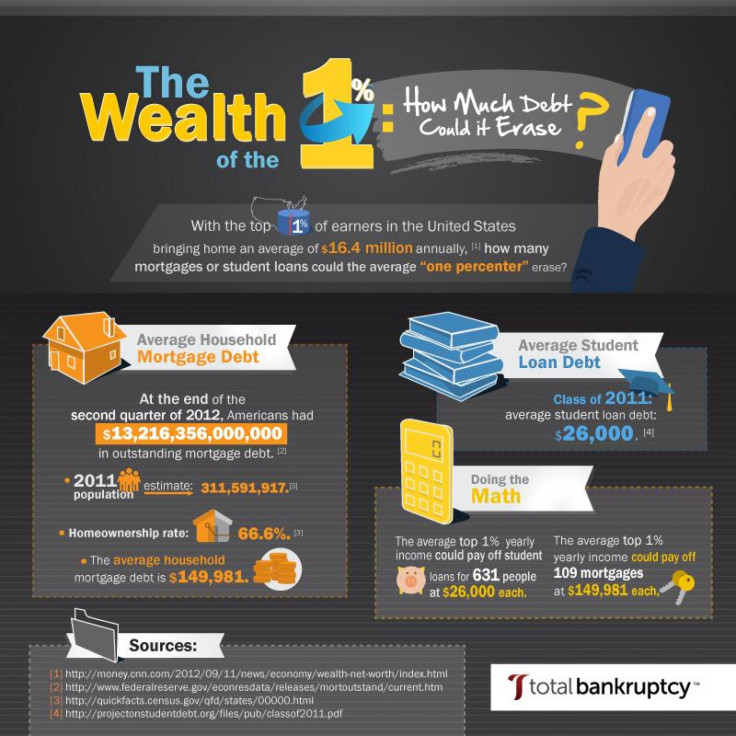
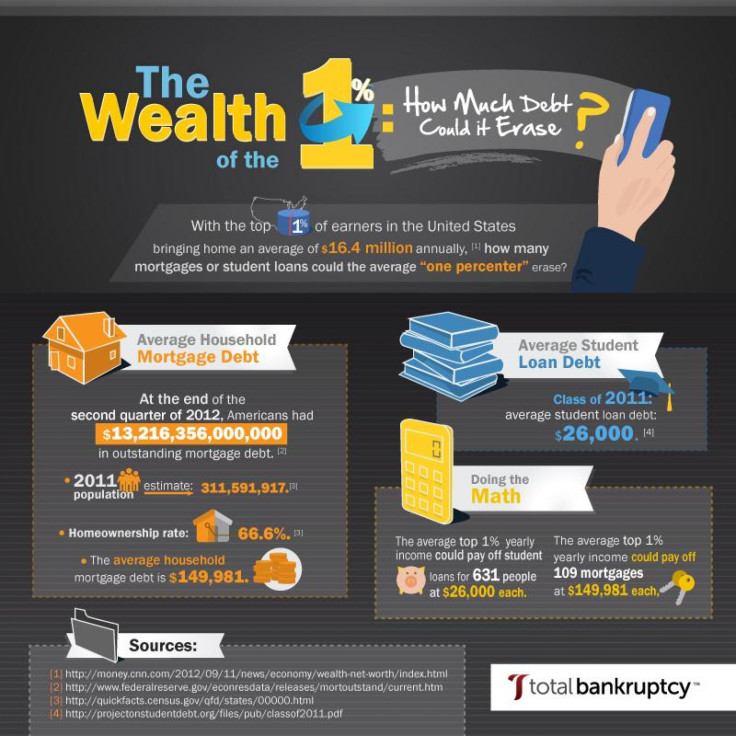
The income of just one 1 percenter, coming in at an average of $16.4 million each year, could pay off student loans for 631 people (at $26,000 each, the average student debt compiled by the class of 2011), 109 mortgages (at $149,981 each, the average household mortgage debt), or the credit card debt of 3,600 others (at $4,554,000 each), according to Total Bankruptcy Attorneys, which released two infographics analyzing the wealth of the 1 percent.

The top 10 percent of earners in the United States have seen their average incomes rise by an additional $116,071 to $254,867 since 1966 -- an increase of 84 percent -- according to a new study of tax data from Pulitzer Prize-winner David Cay Johnston. Meanwhile, the bottom 90 percent, or most of the country, saw their incomes rise by a paltry $59 during that same period.
It’s one of several recent studies highlighting how wage growth has stagnated for everyone but the mega-rich. For instance, one study determined that pay for corporate CEOs has increased 127 times faster than worker pay in the past 20 years. Median hourly wages for workers has barely changed since the early 1970s, according to several analyses of government data.
The disparities in wage growth is one of the reasons the U.S. currently has one the largest rates of income inequality on the planet. According to a 2011 report by the Organization for Economic Co-Operation and Development, the U.S. has the fourth-highest per capita rate of income inequality, following only Chile, Mexico and Turkey.
Social mobility – essentially, the premise of the American dream – is becoming increasingly difficult, if not rare, due to the steady rise of income inequality, the Congressional Research Service reports.
© Copyright IBTimes 2024. All rights reserved.


